Meteo France Nos produits et services
STATE OF THE SEA
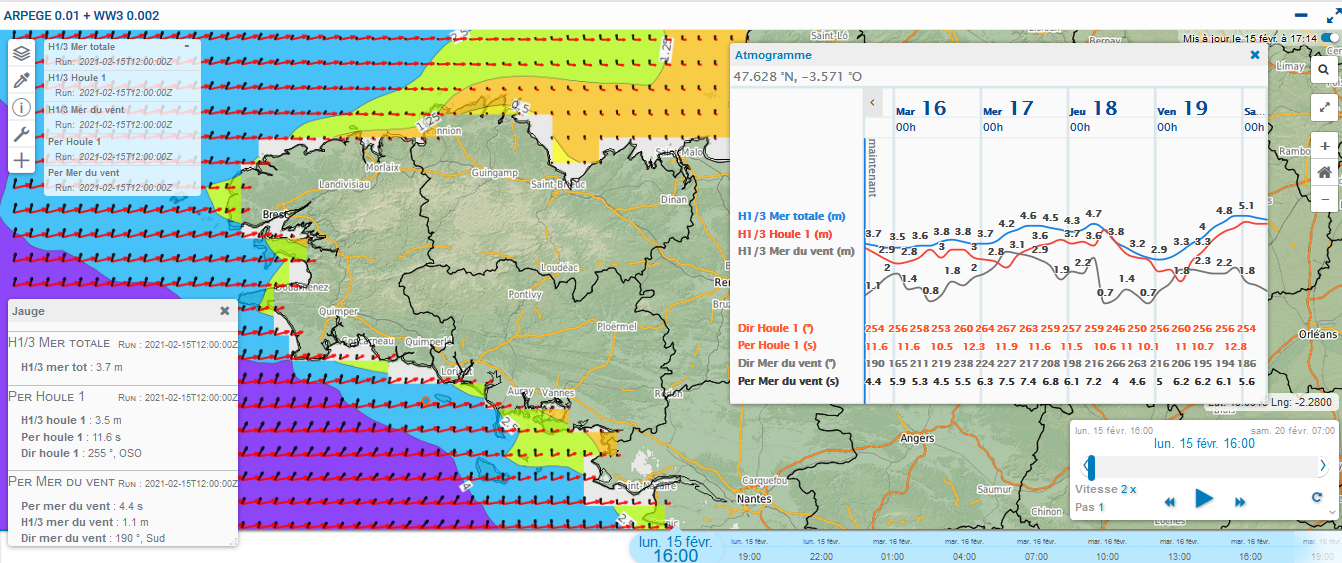
On your extranet, find the state of the sea in the form of maps or forecast tables.
- Mapping is made up of many tools: selection of base map, gauge, legend, tools (variable depending on the subscription chosen). The menu has terminals that allow you to choose an animation time period. You will be able to visualize the forecast of the sea state. A user manual is provided.
The state of the sea is integrated into this map. Using the gauge, you will have the precise values of the total sea, the swell and the wind sea.
- The forecast table represents in the form of a pictogram: the total sea, the swell and the wind sea, but also the wind, the pressure, the temperature and sensitive weather.